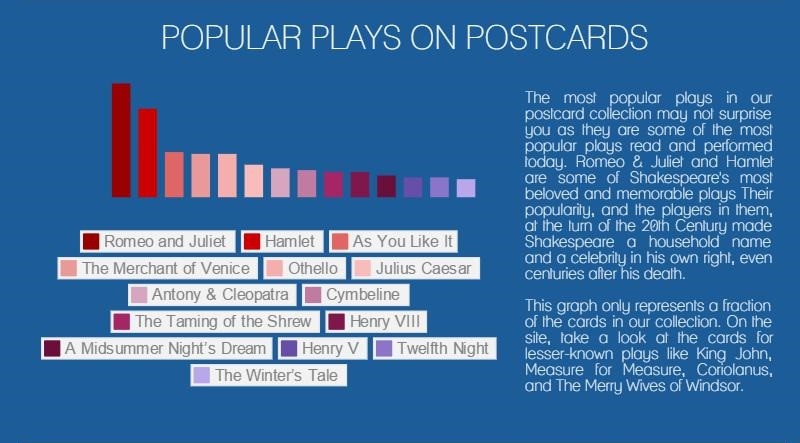
Visualizing Data from the Collection
Many people have inquired about the contents in our collection – the number of postcards, the most frequently photographed players, the most performed plays. We have assembled visualizations of much of this data for you to view. Click through the images below to get a sense of the scope of Shakespeare & the Players.
Shakespeare in Vogue
This data shows the popularity of Shakespeare (as a printed term) between the years 1800 and 2000. As you can see in the interactive Google Ngram graph below, Shakespeare peaked in the early 20th Century, in 1906 to be precise. In these important years, many of the players in our collection – Lily Brayton, Sir Beerbohm Tree, Sir Henry Irving, Matheson Lang, Julia Marlowe – were in their heyday or twilight, promoting the Bard and spreading Shakespeare throughout the world through postcards.
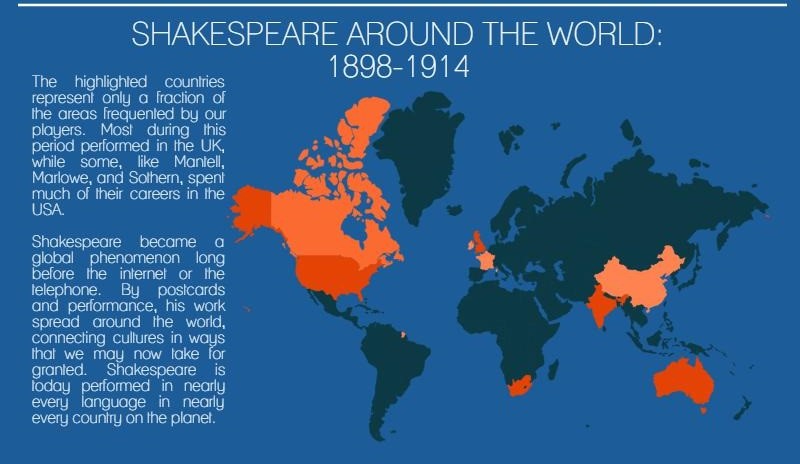
Shakespeare in the Postcard Age
At the very beginning of the popularization of postcards, around 1875, we find Shakespeare. The postcards in our collection were printed between 1880 and 1914 and depict productions of plays between those years as well. As we can see in this Google Ngram, there was significant increase in the use of the term “postcard” during these years in the early 20th Century when Shakespeare was also in vogue. Take a look at the interactive graph below to see more about the years when postcards, and particularly those of Shakespeare plays, were in vogue.
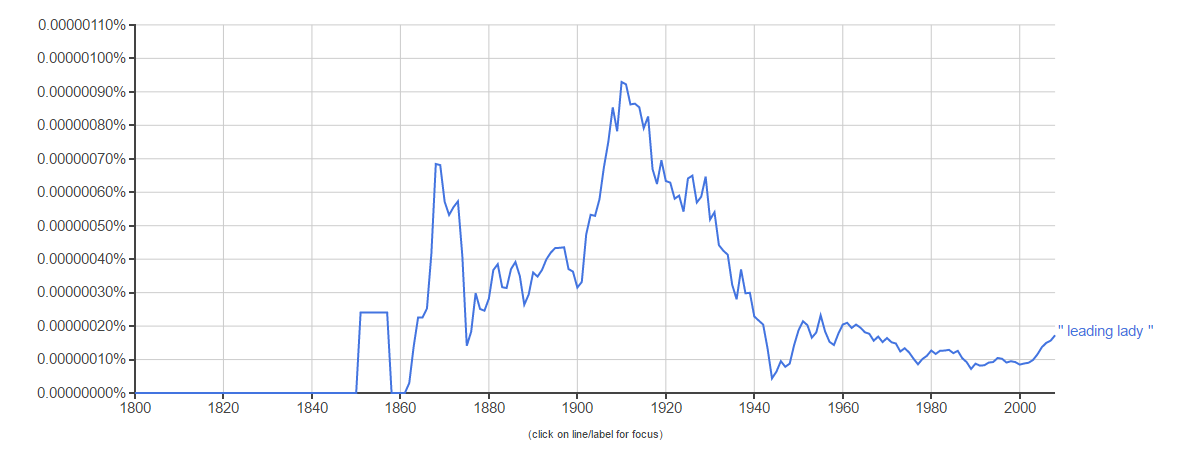
Shakespeare’s “Leading Ladies”
Also, we’ve used Google Ngram to search for the usage of the term “leading lady” across the last two centuries. “Shakespeare’s Leading Ladies” and the status of women in theater is a major focus of the corresponding exhibit for this site, currently located on the campus of Emory University. As the graph shows, the term “leading lady” was in vogue in the first decade of the 20th Century. It signified the greatest female actors on English and American stages during the period, and emphasized their prowess in delivering some of the most poignant lines Shakespeare ever wrote. The term, now out of fashion and problematic in many ways, was also often used in conjunction with and to naturally anticipate a “leading man” on stage. Here, we reclaim that term to resurrect interest in Shakespeare’s most beloved characters, such as Lady Macbeth, Portia, Beatrice, Cleopatra, and Juliet, and also the monumental female actors, like Dame Ellen Terry, Julia Marlowe, Gertrude Elliott, and Constance Collier, who brought them to life and effectively ushered in a revolution for women’s status and rights in the professional world. Click the image below to see the graph in more detail.
Actor-Managers: Celebrities in the Making
One more focus of collection as a whole is the actor-manager system. In the late 19th and early 20th Centuries, Shakespearean stage actors like Evelyn Millard and Julia Neilson commanded salaries that rival payouts for top movie stars today. A number of them had the foresight to manage their own acting companies, traveling around the world, showcasing new talent, staging new productions. Some of these companies were housed in specific theaters around London, Manchester, and New York. Taking notes from the monopolizing industrialists of the time, some of these stage actors such as Sir Herbert Beerbohm Tree, Maxine Elliott, and Sir Frank Benson had the acumen to build their own theaters and collect the profits and the fanbase, effectively giving them access to the most elite circles of politics, industry, and art in the world. These actor-managers, as they were called, had the prestige to shape the way people understood Shakespeare, and any encounter with Shakespeare is an encounter with oneself. Much of this influence both on and off the stage remains today. This term has fallen out of use through the decades, but was in vogue during the time span of our collection. The Ngram below shows a gradual increase in the use of the term “manager” between 1845 and 1920, which includes the span of our collection. Explore the interactive graph featuring this data below.